This article shows how to predict expected goals and shooting efficiency from football highlight videos and validate objective ratings of teams and players using the K-means method and principal component analysis by applying these methods to data from J1 League.
This article unveils the secrets behind predicting the probability of a soccer goal from highlight videos. You will learn how to apply the K-means clustering method and principal component analysis for optimal prediction accuracy.
👉 You might check out my free COMPLETE GUIDE ON EXPECTED GOALS.
Foreword
There is a large body of research on game performance and goal expectancy in football, a topic that is often scrutinised by football researchers. Goal expectancy is a valuable tool for predicting a player’s or team’s probability of scoring or conceding a goal. Therefore, the aim of this paper is to infer goal expectancy and shooting efficiency from football highlight videos and to validate objective evaluations of teams and players using the K-means method.
We build a model to predict expected goals in J1 League, Japan’s football league.We demonstrate that team skills can be objectively evaluated by mining football highlight videos and validate our approach through the detailed analysis of an actual match.
Sample Size and Methods
This article unveils the secrets behind predicting the probability of a soccer goal from highlight videos. You will learn how to apply the K-means clustering method and principal component analysis for optimal prediction accuracy.
Sample size
The total number of shots in the J1 League (0-22, 429 J1 players, 218 matches) for the 2020-2021 season with a 95% confidence interval was collected while watching on DAZN. The dataset contains 4665 shots, removing penalties and not including own-goals. (Including penalty kicks.) In addition, the number of shots per game was obtained using data on players’ minutes from J-Stats.
Methods
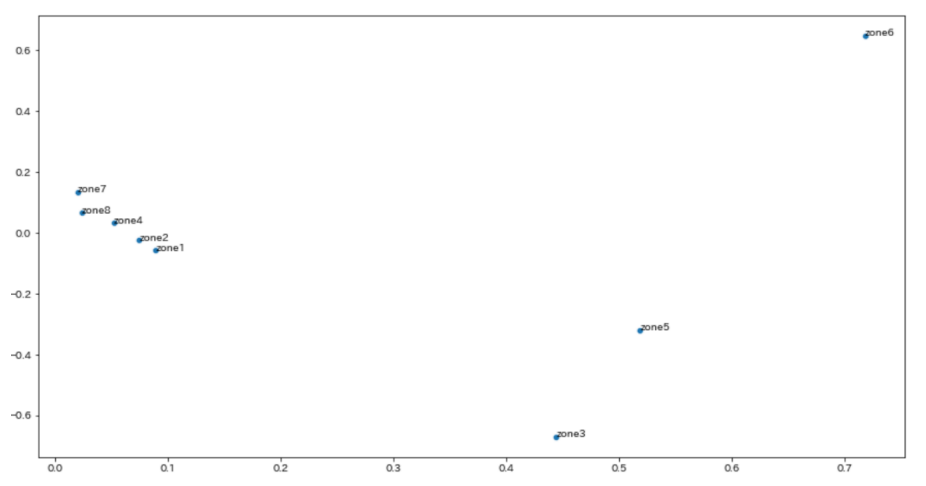
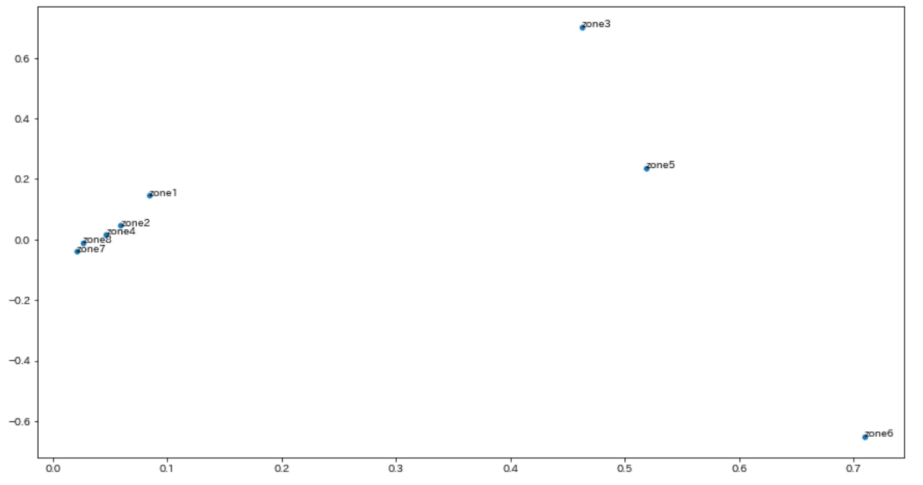
The calculation of goal expectancy values was constructed according to Rathke, A (2017) by dividing all shots into eight zones using the coordinates X (distance from the centre of the goal) and Y (angle from the centre of the goal), as shown in Figure 1. To calculate the expected goals for each club during the season, the number of shots per zone area was multiplied by the corresponding ratio of goals per shot. Shooting efficiency was measured using the statement ‘actual number of goals divided by expected number of goals’ as described above by Rathke, A (2017). The paper also used the K-means method (non-hierarchical cluster analysis) and principal component analysis for objective evaluation of teams and players using scikit-learn, a Python machine learning library.
(Figure 1) Eight zone areas.

(Figure 2) Expected goal of team and Relationship between the number of goals
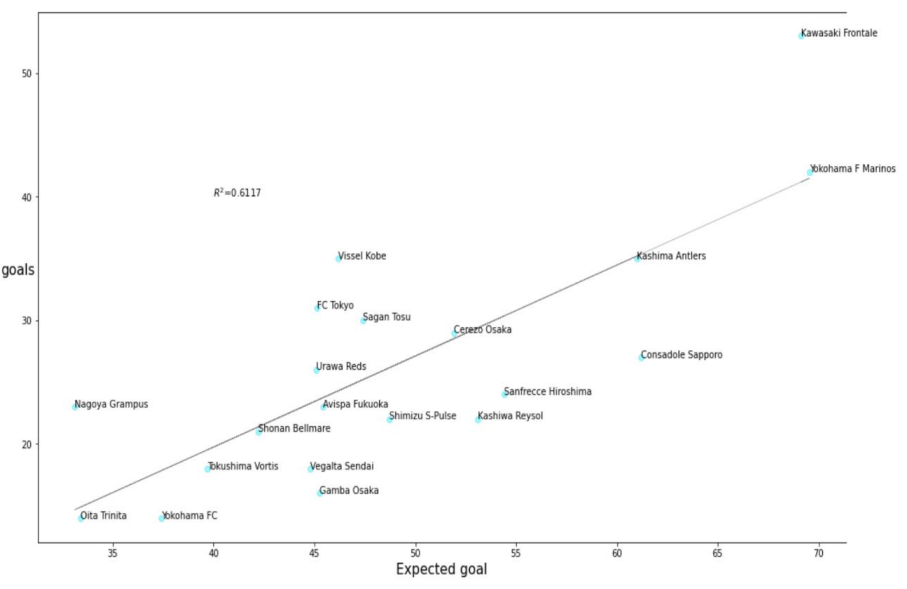
In J1, the difference between Kawasaki Frontale and Yokohama F Marinos in terms of goals scored per game (Kawasaki Frontale: 2.41, Yokohama F Marinos: 2) and goals expected when given the chance (Kawasaki Frontale: 3.14, Yokohama F Marinos: 3.31) is The fact that there were fewer of them shows that their results are outperforming the other teams for the 2020/2021 season.
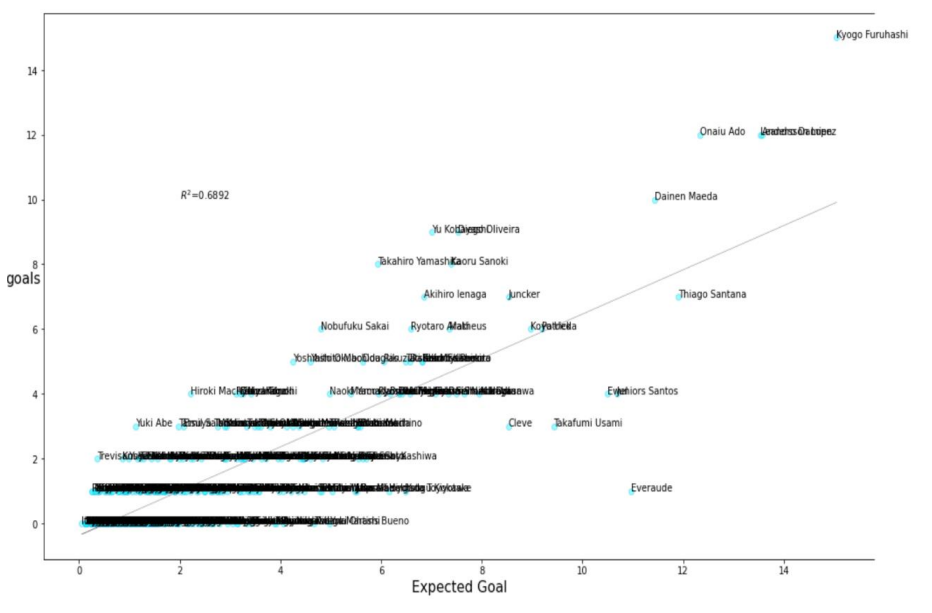
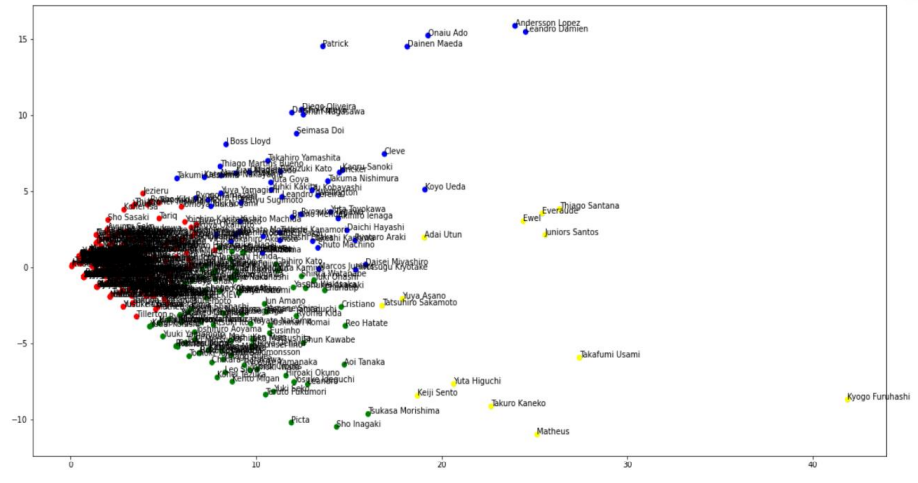
(Figure 3) Expected goal of player and Relationship between the number of goals
In J1, Kyogo Furuhashi had the 1st highest number of shots that season (78), with 53% of them coming from inside the box. In this case, it can be said that Kyogo Furuhashi is a player who shoots more and can score goals from low quality shots (zone 6).
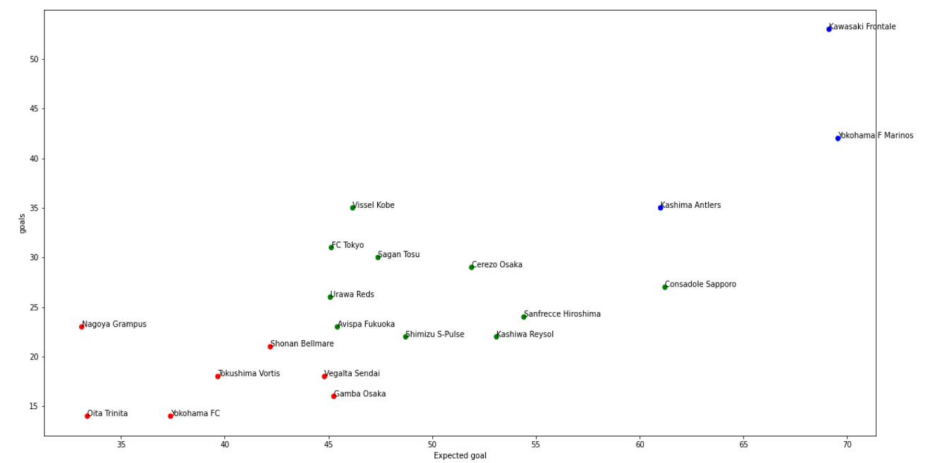
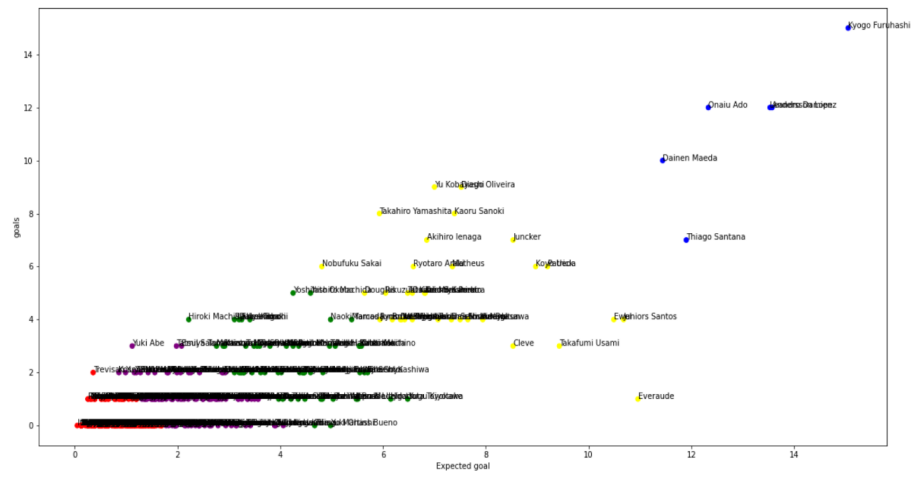
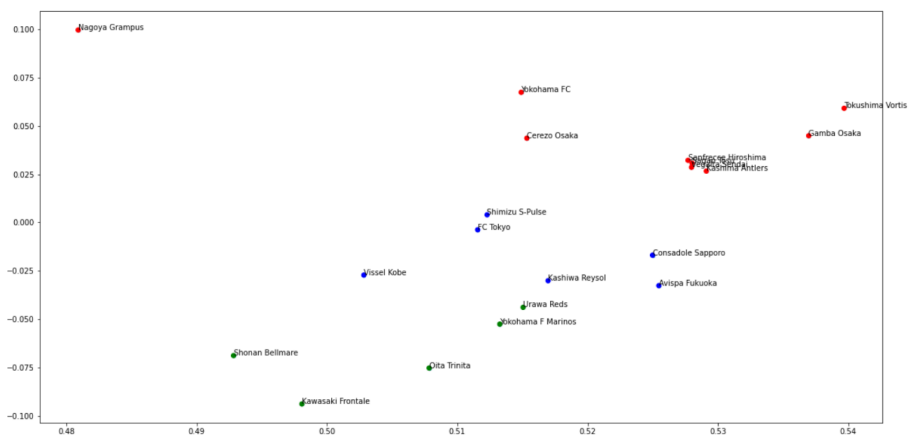
(Figure 5) K-means method (non-hierarchical cluster analysis) and principal component analysis of teams and players
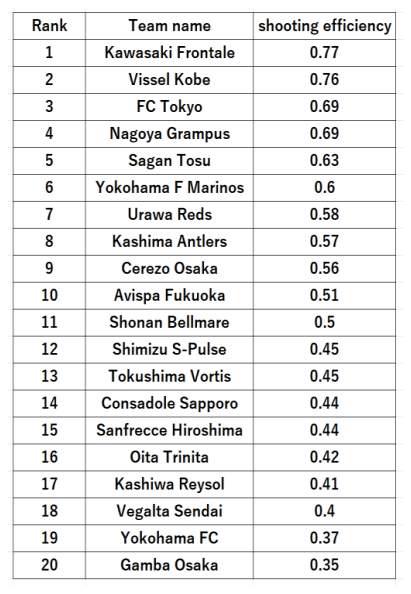
(Table 1) Team shooting efficiency
Conclusion
This study demonstrates the value and reliability of goal expectancy in Japanese football J1 League. The direct practical application of this method would be useful for clubs to identify players and negotiate prices in the transfer market. I hope that this research will lead to further development of Japanese football.
This model can be extended to predict expected goals in major leagues like: La Liga, Serie A, Bundesliga, Premier League also team competitions like Champions League, Europa League and the outcoming Qatar 2022. It can also be a nice tool for NFT Sorare gameplay to select your squad to maximize your team results.
This original paper study has been compiled by Ryuji Sasaki a bright student from Tokai University in Japan and football video analyst focused on Expected Goal Research and big fan of Houston Dynamo, LFC, Celtic and Manchester City. You can directly contact him on @ExpectedGoal1